Academic, Social, and Civic Development
College Career Readiness
Indicators for post-secondary success:
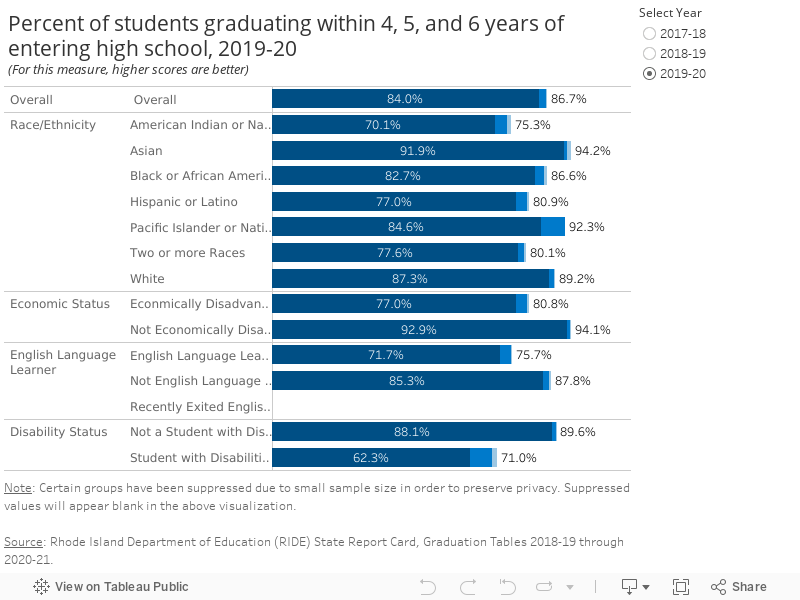
Percent of students graduating within 4, 5, and 6 years of entering high school.
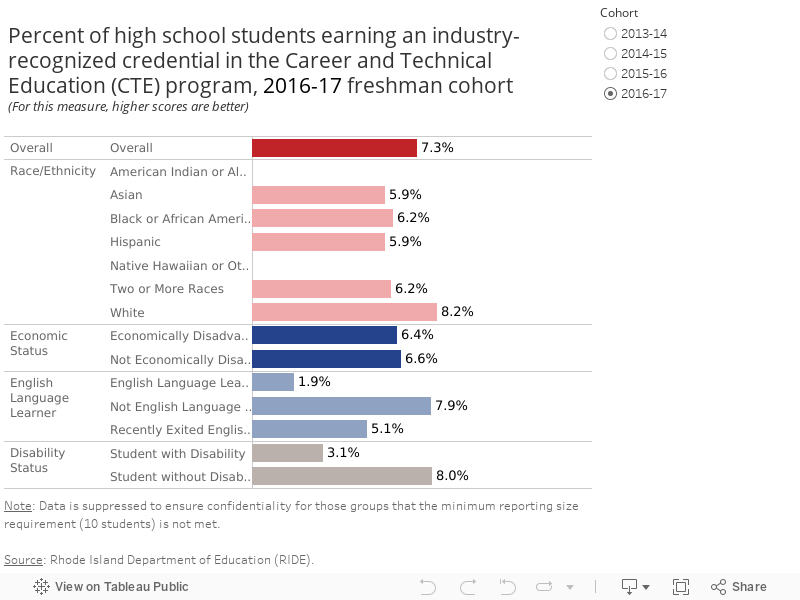
Percent of students earning an industry-recognized credential.
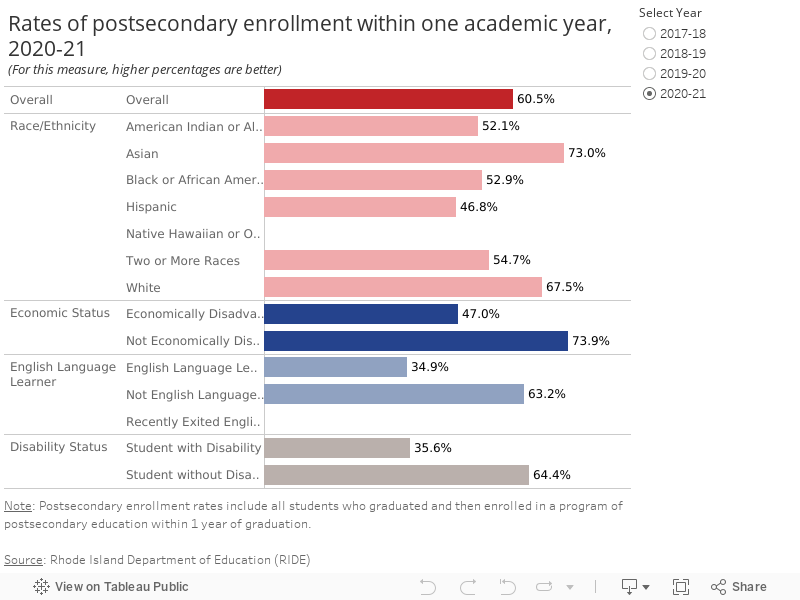
Percent of students persisting in a 2 or 4 year post-secondary institution.
Percent of students graduating within 4, 5, and 6 years of entering high school.
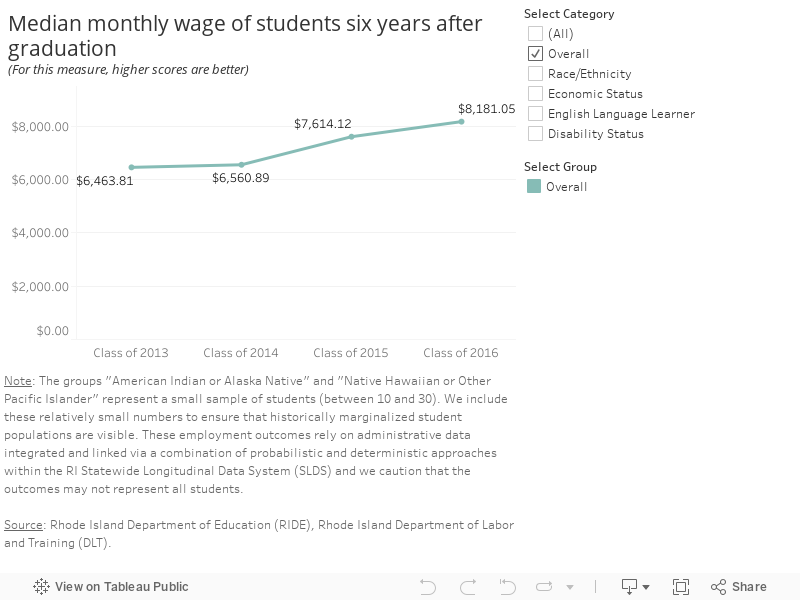
Median monthly wage of students six years after graduation.


About this data
High school graduation and the percentage of students earning an industry credential, along with postsecondary enrollment and persistence, and the median income after high school graduation are indicators of success after high school.
High School graduation rates are calculated using a cohort method. This reflects the percent of students who graduate from high school within four years of entering, calculated by dividing the number of students who graduate in four years or fewer by the total number of first-time entering ninth graders (adjusted for transfers in and transfers out). Separate rates are calculated for the percentage of students who are retained in high school and take more than four years to graduate and for the percentage of students who received their GED within four years instead of graduating with a traditional diploma. The dark color indicates the four-year graduation rate, with the lightest shade reflecting the six-year graduation rate.
For the class that entered high school as freshmen during the 2016-17 school year, 7.3% earned an industry-recognized credential. This is an increase from the 4.5% of students entering high school in the 2015-16 school year. Students with disabilities and English Language Learners continue to have the lowest rates at 1.9% and 3.1% respectively.
Postsecondary enrollment consists of all students who graduated from high school in a given school year who enroll in programs of postsecondary education in the first academic year that begins after the students' graduation. Using RIDE's high school completer data along with National Student Clearinghouse's postsecondary enrollment data, RIDE determines the type of postsecondary program students have enrolled in upon graduation. For the purposes of reporting on postsecondary enrollment, an institution of higher education must meet specific criteria; for example, it must be accredited, it must be a public or non-profit institution, and it must award a bachelor's degree or provide a 2-year program that is acceptable for full credit toward such a degree.
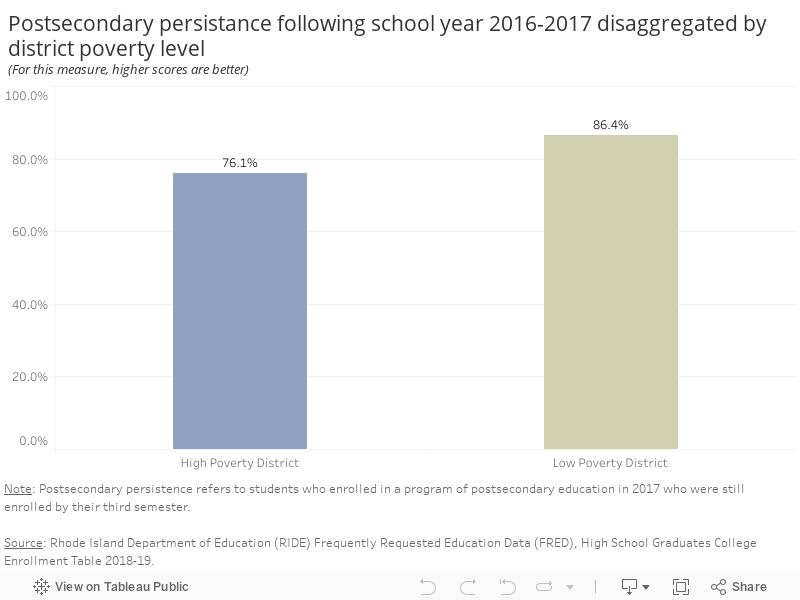
Postsecondary persistence refers to the percent of students who were still enrolled in a postsecondary institution by their third semester. This measure is broken out by High and Low Poverty Districts. High Poverty Districts are defined as a district where 40 percent or more of students are eligible for free and reduced-price lunch. Low Poverty Districts are districts where fewer than 40 percent of students are eligible for free and reduced-price lunch. The data demonstrates that students who attended a High Poverty District were less likely to persist in postsecondary education.
While graduation rates across the state have remained consistent, the rate of postsecondary enrollment continues to decline. English language learners and students with disabilities demonstrate the lowest graduation rates and are least likely to enroll in postsecondary education.
The annual wage of students six years after high school graduation has remained steady or increased for most students, with English Language Learners being the only subgroup with earnings that decreased. Students with disabilities did see some growth in earnings, but continue to have the lowest annual wages.
Graduation Rates
Industry Recognized Credentials
Postsecondary Enrollment
Postsecondary Persistence
Median Annual Wage