High Standards
Rigorous Assessment System
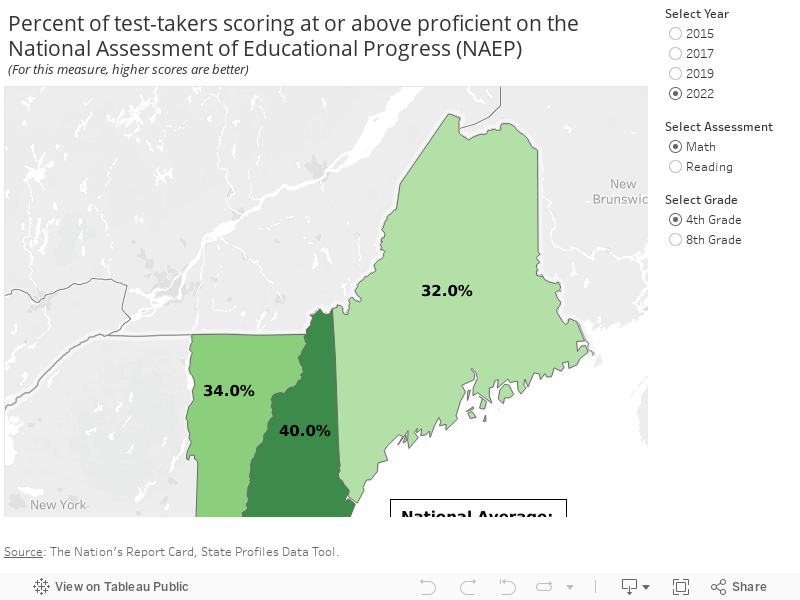
Percent of test-takers scoring at or above proficient on the NAEP.
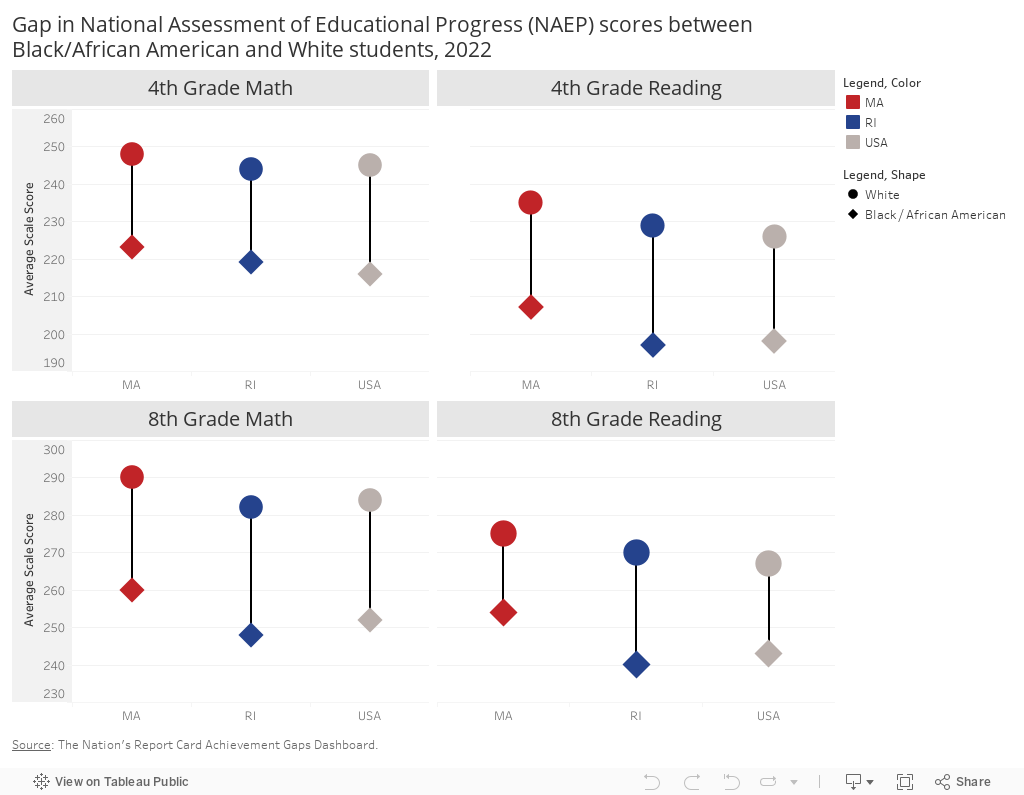
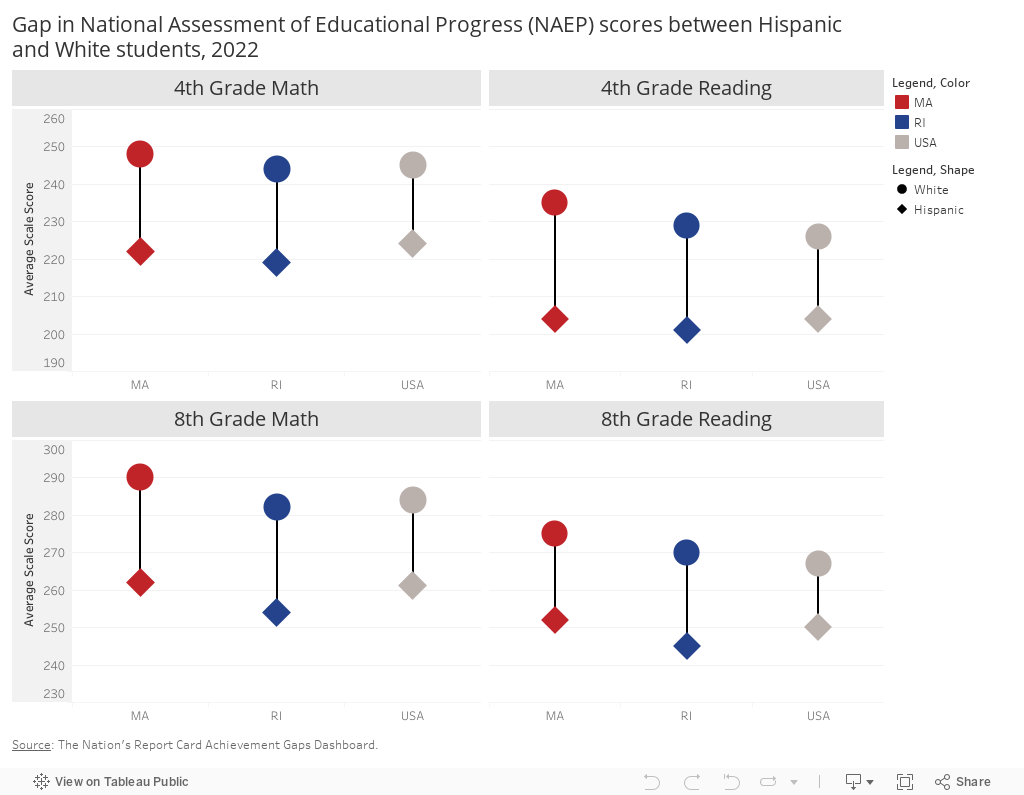
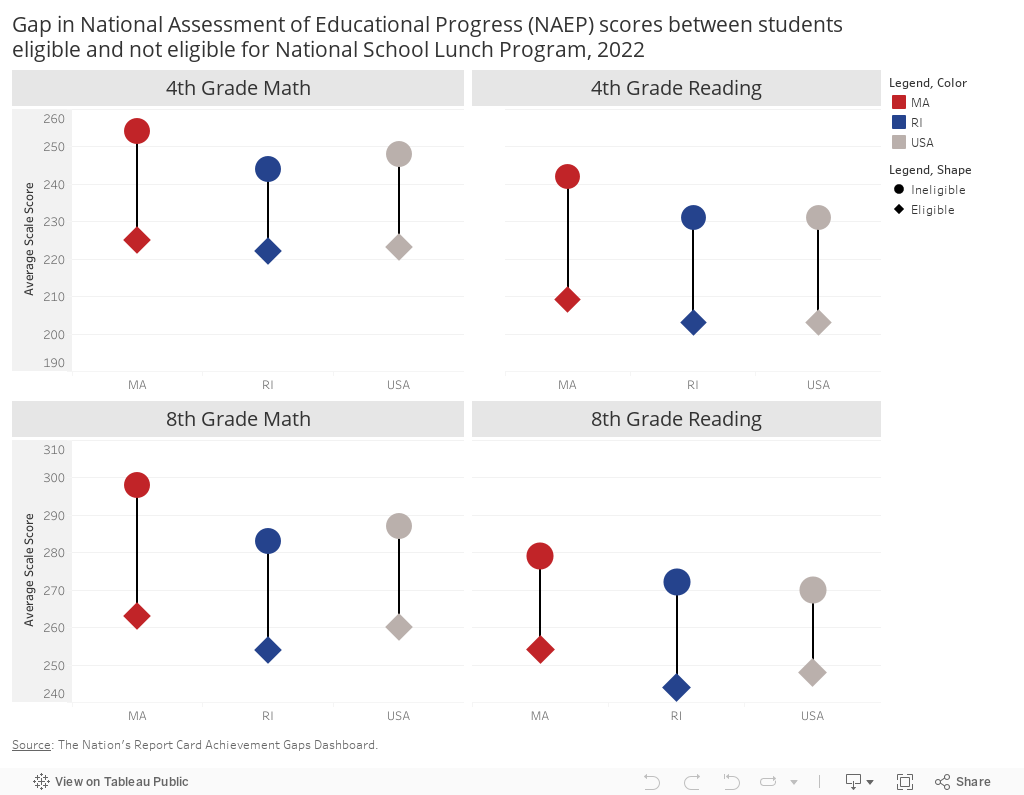
Average scaled score gap between racial and economic subgroups.


About this data
The National Assessment of Educational Progress (NAEP) is the largest nationally representative and continuing assessment of students in the United States. The results are released as The Nation’s Report Card and provide data on the national and state levels. NAEP is administered every two years for fourth-, eighth-, and twelfth-graders. While some growth has been seen over the past several years, Rhode Island continues to lag behind other New England states.
Three different groups are compared to show the NAEP Proficiency Gap in Math and Reading for 4th and 8th graders. Comparisons show White students compared to Black students, White students compared to non-White Hispanic students, and economically disadvantaged students compared to non-economically disadvantaged students. Economically disadvantaged is defined as students eligible for Free and Reduced Price Lunch (FRPL). FRPL is used as an indicator of low income nationally. Rhode Island continues to have large proficiency gaps across Black, non-White Hispanic, and economically disadvantaged students. In many instances these gaps are larger than the national gaps seen across these groups.
NOTE: The NAEP was not administered in the 2020-21 school year due to the COVID-19 pandemic.
New England Assessment Scores
Rhode Island Student Group Assessment Score Gaps